Sustainability Nexus Analytics, Informatics, and Data (AID) Programme

AIR POLLUTION
WHY DOES AIR POLLUTION
MATTER?
-
Short- and long-term exposure to air pollution can lead to a wide range of health issues, including stroke, heart disease, lung cancer, pneumonia, and respiratory diseases such as asthma.
-
Air pollution is one of the greatest environmental risks to health. Nine out of 10 people worldwide breathe air containing unhealthy levels of pollutants, contributing to approximately 7 million deaths every year [link].
-
The estimated global cost of health damages related to exposure to air pollution is $8.1 trillion, equivalent to 6.1% of global gross domestic product [link].
-
Low- and middle-income countries suffer the greatest burden from exposure to air pollution, with approximately 90% of pollution-related deaths and largest economic losses occurring in these countries [link].
-
Many sources, such as coal-fired power plants and diesel-fueled vehicles, emit both air pollutants and greenhouse gases; therefore, policies to reduce air pollution can reduce pollution-related health impacts while also aiding in the mitigation of climate change [link].
-
Air pollution associated with smoke from wildfires is expected to increase as climate change promotes more frequent wildfires and a longer wildfire season [link].
WHY A NEXUS APPROACH?
Air pollution is a complex problem consisting of many different natural and anthropogenic sources (e.g., industrial facilities, power plants, vehicles) that emit air pollutants and contribute to air quality issues throughout the globe. Emissions of primary air pollutants, including nitrogen dioxide (NO2), sulfur dioxide (SO2), carbon monoxide (CO), and particulate matter (PM), from these different sources lead to the formation of secondary air pollutants, such as ozone (O3) and secondary PM, in the lower atmosphere. The production and transport of air pollutants in the atmosphere govern air quality conditions at the local, regional, and global-scale, which stresses the need for a global collaborative effort to better understand and manage air pollution. Anthropogenic emissions tend to be stronger across lower income communities, leading to disproportionality higher levels of air pollution damages on these population groups. By enacting air pollution policies and regulations, we can reduce anthropogenic emissions and improve air quality across all communities. There are also critical links and feedbacks between air pollution and climate change. Increases in temperatures due to climate change can lead to more frequent high-ozone pollution events and greater health effects. The increasing frequency of wildfires and longer wildfire season driven by climate change have contributed to higher concentrations of smoke and elevated PM levels, which have offset national-level air quality improvements following air pollution policies [link]. Altogether, an international collaborative effort through the nexus approach is needed to better understand and manage the complex global-scale air pollution problem.
AID TOOLS
Effectively monitoring and managing air pollution throughout the globe requires using the network of satellite and ground-based instruments in conjunction with chemical transport model forecasts.
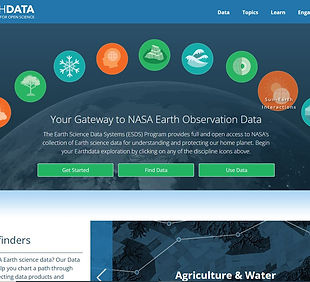
NASA Earthdata
A gateway to Earth observation data, particularly NASA satellite data with a focus area on air quality. Earthdata Search and Worldview are available for downloading and visualizing air quality data from a suite of satellite instruments including trace gas products (i.e., NO2, SO2, O3) from the Ozone Monitoring Instrument (OMI) and aerosol optical depth (AOD) products from the Moderate Resolution Imaging Spectroradiometer (MODIS) instruments and NOAA Visible Infrared Imaging Radiometer Suite (VIIRS) instrument. Trace gas and aerosol products from the TROPOspheric Monitoring Instrument (TROPOMI) onboard the European Space Agency (ESA) Sentinel-5 Precursor (S5P) satellite are also available for download. Air quality products from the Tropospheric Emissions: Monitoring of Pollution (TEMPO) instrument will be available in 2024 (anticipated April 2024).
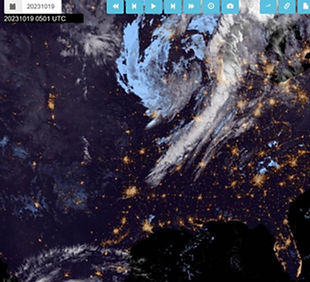
NOAA AerosolWatch
A platform for visualizing True Color, Dust, and Fire Red-Green-Blue (RGB) imagery, Smoke Dust Mask, and AOD from NOAA’s Geostationary Operational Environmental Suite (GOES) East and West satellites and VIIRS instrument. Visualizations of trace gas products from TROPOMI are also available, in addition to daily AOD-estimated PM2.5 (PM less than 2.5 microns in diameter) and hourly and daily PM2.5 from U.S. EPA’s AirNow monitoring network.

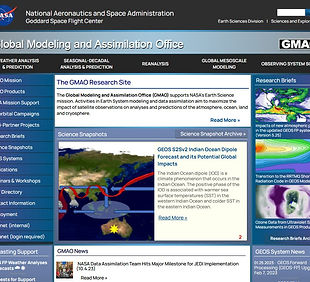
Global Modeling and Assimilation Office
Website that provides links to downloading Goddard Earth Observing System (GEOS) model data from a suite of products, including aerosol and trace gas data from the GEOS Forward Processing (FP) and Composition Forecast (GEOS-CF) systems. An interactive tool for visualizing GEOS-FP and GEOS-CF data is also available.
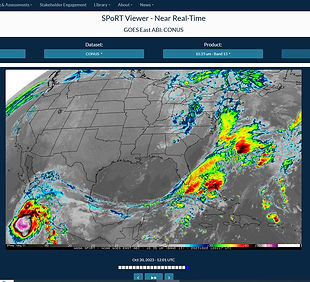
NASA SPoRT Viewer
Viewer provided by the NASA Short-term Prediction Research and Transition (SPoRT) center for visualizing RGB imagery from the Advanced Meteorological Instrument (AMI) onboard the Geostationary Korea Multi-Purpose Satellite – 2A (GEO-KOMPSAT-2A), level 2 and 3 trace gas products from TROPOMI, level 2 and 3 trace gas and aerosol products from the Geostationary Environment Monitoring Spectrometer (GEMS). Visualizations of derived level 4 surface-layer trace gas and PM2.5 products from a suite of satellite instruments are also available.
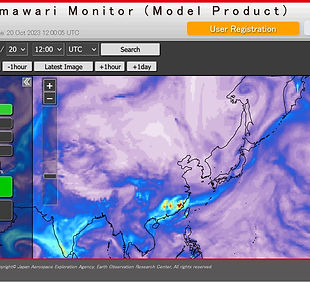
JAXA Himawari Monitor
Platform for visualizing 10-min, hourly, daily, and monthly AOD data from the Advanced Himawari Imager (AHI) onboard the Himawari-9 geostationary satellite. Wildfire hot spot detections are available at 10-min and hourly frequency. Hourly forecasts of aerosol properties (AOD, PM2.5, PM10) from the Model for Aerosol Species IN the Global AtmospheRe (MASINGAR) are also available.
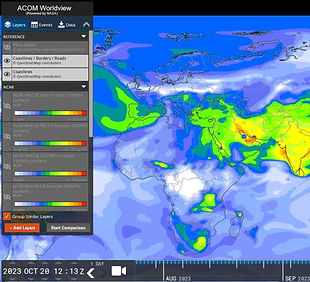
ACOM Worldview
A NASA-developed Worldview tool provided by the NCAR Atmospheric Chemistry Observations and Modeling (ACOM) laboratory with the same features as the Worldview tool at NASA Earthdata but with added visualizations of ACOM’s global chemical forecasts from the Whole Atmosphere Community Climate Model (WACCM) and GEMS satellite products.
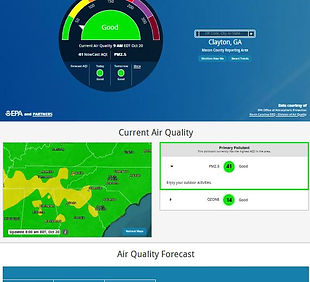
AirNow
Website for downloading and visualizing air quality data from the U.S. EPA’s AirNow monitoring network. An interactive map for viewing current and archived data of O3, PM2.5, and PM10 from AirNow monitors across the globe, along with O3 and PM Air Quality Index (AQI) forecasts issued by state and local air quality forecasters. A fire and smoke map including air quality data from low-cost sensors and fire and smoke plume information from the NOAA Hazard Mapping System and National Interagency Fire Center are also available.

Get to Know AID Members
You can consult with the AID group leader or any members for your regional, national, and global datasets, tools, and analytics projects and questions.


